Stop Losing Sales: 5 Ecommerce Search Metrics Shopify Stores Must Fix
Fix five ecommerce search metrics and prioritize by volume×failure to recover lost sales from shoppers who use your site search.

Stop Losing Sales: 5 Ecommerce Search Metrics Shopify Stores Must Fix
Track search conversion rate, zero-result rate, percent of sessions using search, search click-through rate, and search exit rate first. Shoppers who use internal search convert roughly 6.4 times more often than those who don’t, so a broken search box is one of the most expensive bugs in your store. Pull your last 30 days of search logs, sort by volume, and triage the top 25 queries that return nothing useful. That single hour of work usually surfaces your fastest revenue fix.
TL;DR:
- Focusing on reducing zero-result search rates provides the biggest opportunity for revenue improvement, especially for high-volume queries with poor matching.
- Regularly reviewing top failing queries and fixing catalog metadata, synonyms, or ranking issues can significantly boost search click-through and conversion rates.
- Tracking search relevance metrics like click-through rate, exit rate, and revenue per visit helps prioritize technical fixes that impact actual sales data.
- Implementing a managed AI search layer can address common relevance problems automatically without extensive developer work, offering quick returns.
- Weekly monitoring and cross-department ownership are critical to maintaining search health and avoiding overlooked issues that cost revenue over time.
Table of Contents
- What Ecommerce Search Metrics Actually Measure
- Where to Pull the Numbers and How Attribution Actually Works
- Turning the Numbers Into a Fix List That Moves Revenue
- Where a Managed Search Layer Fits Into This
- What Search Data Actually Rewards: Speed, Not Perfection
- Get a Prioritized List of Your Worst Search Failures, Free
- Documentation Worth Bookmarking
- Sources
- FAQ
What Ecommerce Search Metrics Actually Measure
Most store owners glance at overall conversion rate and call it a day. That number hides what’s happening inside your search bar, where a shopper who already knows what they want is either finding it in three seconds or leaving in frustration. Here’s every metric worth tracking, with the exact formula and what to do the moment you see a bad number.
Percentage of sessions using search tells you how many visitors bother typing into the search box at all. Formula: (sessions with a search event ÷ total sessions) × 100.
Zero-result rate (also called no-result rate) is the single most damaging metric on this list. Formula: (searches returning zero products ÷ total searches) × 100. Zero-result searches and exit rates are leading indicators of relevance failures, and they compound: every zero-result session that ends in an exit is a shopper who leaves believing you’re out of stock or don’t carry what they wanted.
Search exit rate measures how often a search session ends the visit entirely. Google Analytics defines it as Search Exits ÷ Total Unique Searches. Say you logged 1,000 unique searches last week and 220 of those sessions ended without another pageview.
Search click-through rate (CTR) shows whether your results page actually earns clicks. Formula: (result clicks ÷ total searches) × 100. A query returning 40 products but earning almost no clicks usually means ranking order is wrong, not that the products don’t exist.
Search conversion rate is the metric that ties everything to revenue: (orders credited to a search session ÷ total search sessions) × 100. If 5,000 sessions included a search and 175 of them ended in a purchase, your search conversion rate is 3.5%. Compare that to site-wide conversion rate. If search-assisted sessions convert lower than average, something in the results page or query matching is broken.
A few supporting metrics round out the picture:
- Searches per visit: total searches ÷ sessions with search. High numbers can mean engaged browsing or frustrated re-searching, so check it against exit rate.
- Search refinements: the percentage of searches that are follow-up refinements of a prior query within the same session, calculated as refined searches ÷ total unique searches.
- Time after search and search depth: how long and how many pages a shopper views after searching, both defined with example math in Google Analytics’ site search documentation.
- Search revenue per visit: total revenue from search sessions ÷ number of search sessions, your cleanest dollar-value benchmark.
Statistic to anchor your priorities: search users convert about 6.4 times more often than shoppers who never use the search bar. Every point you shave off zero-result rate or exit rate compounds against that multiplier.
Where to Pull the Numbers and How Attribution Actually Works
Shopify stores have an advantage most platforms don’t: native schemas built specifically for this. The searches and search_queries tables in ShopifyQL expose query text, result counts, clicks, and conversions at the individual query level, not just aggregated site totals. That granularity is what lets you rank failing queries by volume instead of guessing.
Attribution is where most dashboards quietly lie to you. Search-driven revenue gets credited differently depending on the platform’s rules. Some systems credit the order to the last search session before purchase; others credit whichever browse session the product was added to cart in, even if that happened after the shopper navigated away from search results. Before you benchmark search conversion rate against last quarter, confirm the attribution window hasn’t changed, or you’ll chase a number that moved for reasons that have nothing to do with search quality.

A second pitfall: raw search request counts inflate numbers when your search bar uses autocomplete or typeahead, since every keystroke can fire a separate request. Grouping keystrokes into a single search intent before calculating CTR or conversion gives a truer picture than counting every character typed.
Build your dashboard around this checklist:
- Pull query-level volume and zero-result counts from Shopify’s
search_queriesschema weekly. - Cross-reference search sessions against Google Analytics’ Site Search report for exit rate and refinement percentage.
- Set up a report that isolates your top 50 queries by volume, sorted by result count ascending, so failing high-traffic terms surface first.
- Track search revenue per visit monthly against site-wide revenue per visit as your north star comparison.
| Data source | Metrics it supplies | Update frequency |
|---|---|---|
Shopify ShopifyQL (search_queries) |
Query volume, clicks, result counts | Real-time to daily |
| Google Analytics Site Search reports | Exit rate, refinements, time after search, search depth | Daily |
| Vendor search analytics (e.g., Meilisearch, Sitecore dashboards) | CTR, average click position, intent-grouped conversions | Varies by platform |
Turning the Numbers Into a Fix List That Moves Revenue
Not every bad metric deserves the same urgency. A zero-result query that gets searched three times a month isn’t worth an engineering sprint. One searched three thousand times a month is.
Rank problems using a simple formula: priority = query volume × failure rate × inferred purchase intent. This weighting approach keeps you from spending a week fixing an obscure edge case while a high-volume broken query keeps bleeding conversions in the background.
Work through the list in this order:
- Pull your top 25 zero-result and low-CTR queries by volume from the last 30 days.
- Check whether the products shoppers are searching for actually exist in your catalog. If they do, the problem is almost always metadata, synonyms, or a plural/singular mismatch.
- Fix synonym mapping and tags for the queries where products exist but aren’t matching.
- Adjust ranking or merchandising rules for queries that return results but earn low clicks, usually a sign the best-selling or most relevant item isn’t surfacing first.
- Run a two-week validation test on the fixed queries before declaring victory.
After each fix, watch three post-fix indicators: CTR lift on the specific query, drop in search exit rate for that segment, and the conversion delta compared to the two weeks prior. If none move, the fix targeted the wrong root cause.
Pro Tip: Resist the urge to chase every long-tail zero-result query to zero. A handful of searches for a product you’ll never stock isn’t a search problem, it’s a catalog gap. Spend your fix budget where volume and intent both run high.
Where a Managed Search Layer Fits Into This
Some teams run this whole triage process in-house every week. Others don’t have the engineering bandwidth to touch synonym dictionaries and ranking rules on a rolling basis, and that’s a real constraint, not a failure of process.
A fully managed AI search layer built specifically for Shopify stores addresses the failure points this article covers:
- Typo tolerance and semantic matching, so a misspelled or loosely worded query still surfaces the right product.
- Activation without a development sprint, since there’s no setup required on the merchant’s end.
- Continuous relevance tuning based on real store search data rather than a one-time configuration.
- A visual merchandising grid editor for adjusting result ranking without touching code.
Merchants have reported meaningful recoverable revenue tied to fixed search failures, with some figures published by providers as self-reported results. A free audit works well as a starting point regardless of which route you take: it hands you a prioritized list of your highest-impact failing queries, the same triage this article walks through, without requiring you to build the reporting yourself first.
What Search Data Actually Rewards: Speed, Not Perfection
The teams that get the most out of ecommerce analytics don’t chase every metric on this list at once. They start with query triage because it’s the fastest path to a dollar figure a finance team will actually believe. Fixing your top 10 zero-result queries this week beats a quarter-long project to rebuild your entire search architecture.
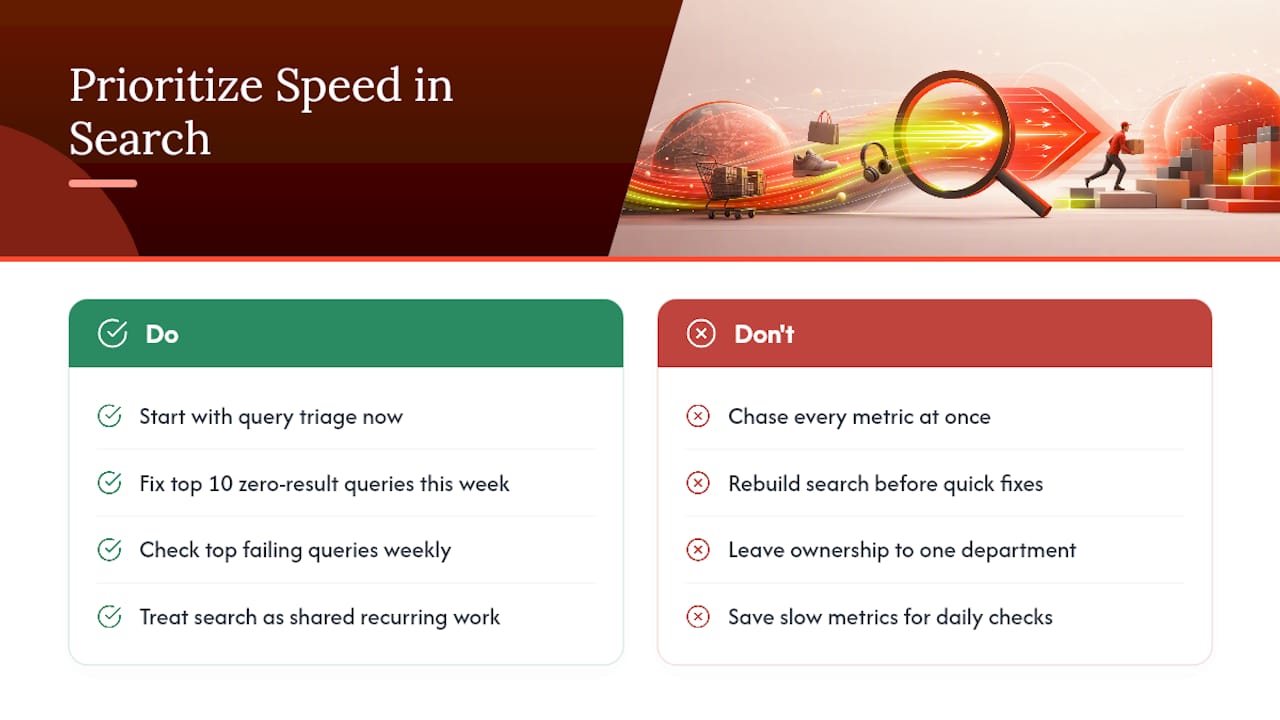
Review cadence matters more than most dashboards suggest. Check top failing queries weekly, since new products and seasonal terms shift fast enough that a monthly cycle misses them. Save the slower metrics, exit rate trends, revenue per visit, search depth, for a monthly review where you’re looking for direction, not daily noise.
Ownership tends to fail when it sits with one department alone. Merchandising teams know which products should rank where; analytics teams know how to read the exit and conversion data correctly. The stores that fix search fastest treat it as a shared, recurring job, not a one-time project handed to whoever set up the store originally.
— Barikreativa
Get a Prioritized List of Your Worst Search Failures, Free
Indexa is the alternative to spending weeks manually mining ShopifyQL exports for the queries actually costing you sales. Instead of building the triage dashboard described above from scratch, you get a prioritized breakdown of your store’s highest-impact failing searches in one pass, ranked the same way this article recommends: by volume, failure rate, and buying intent.
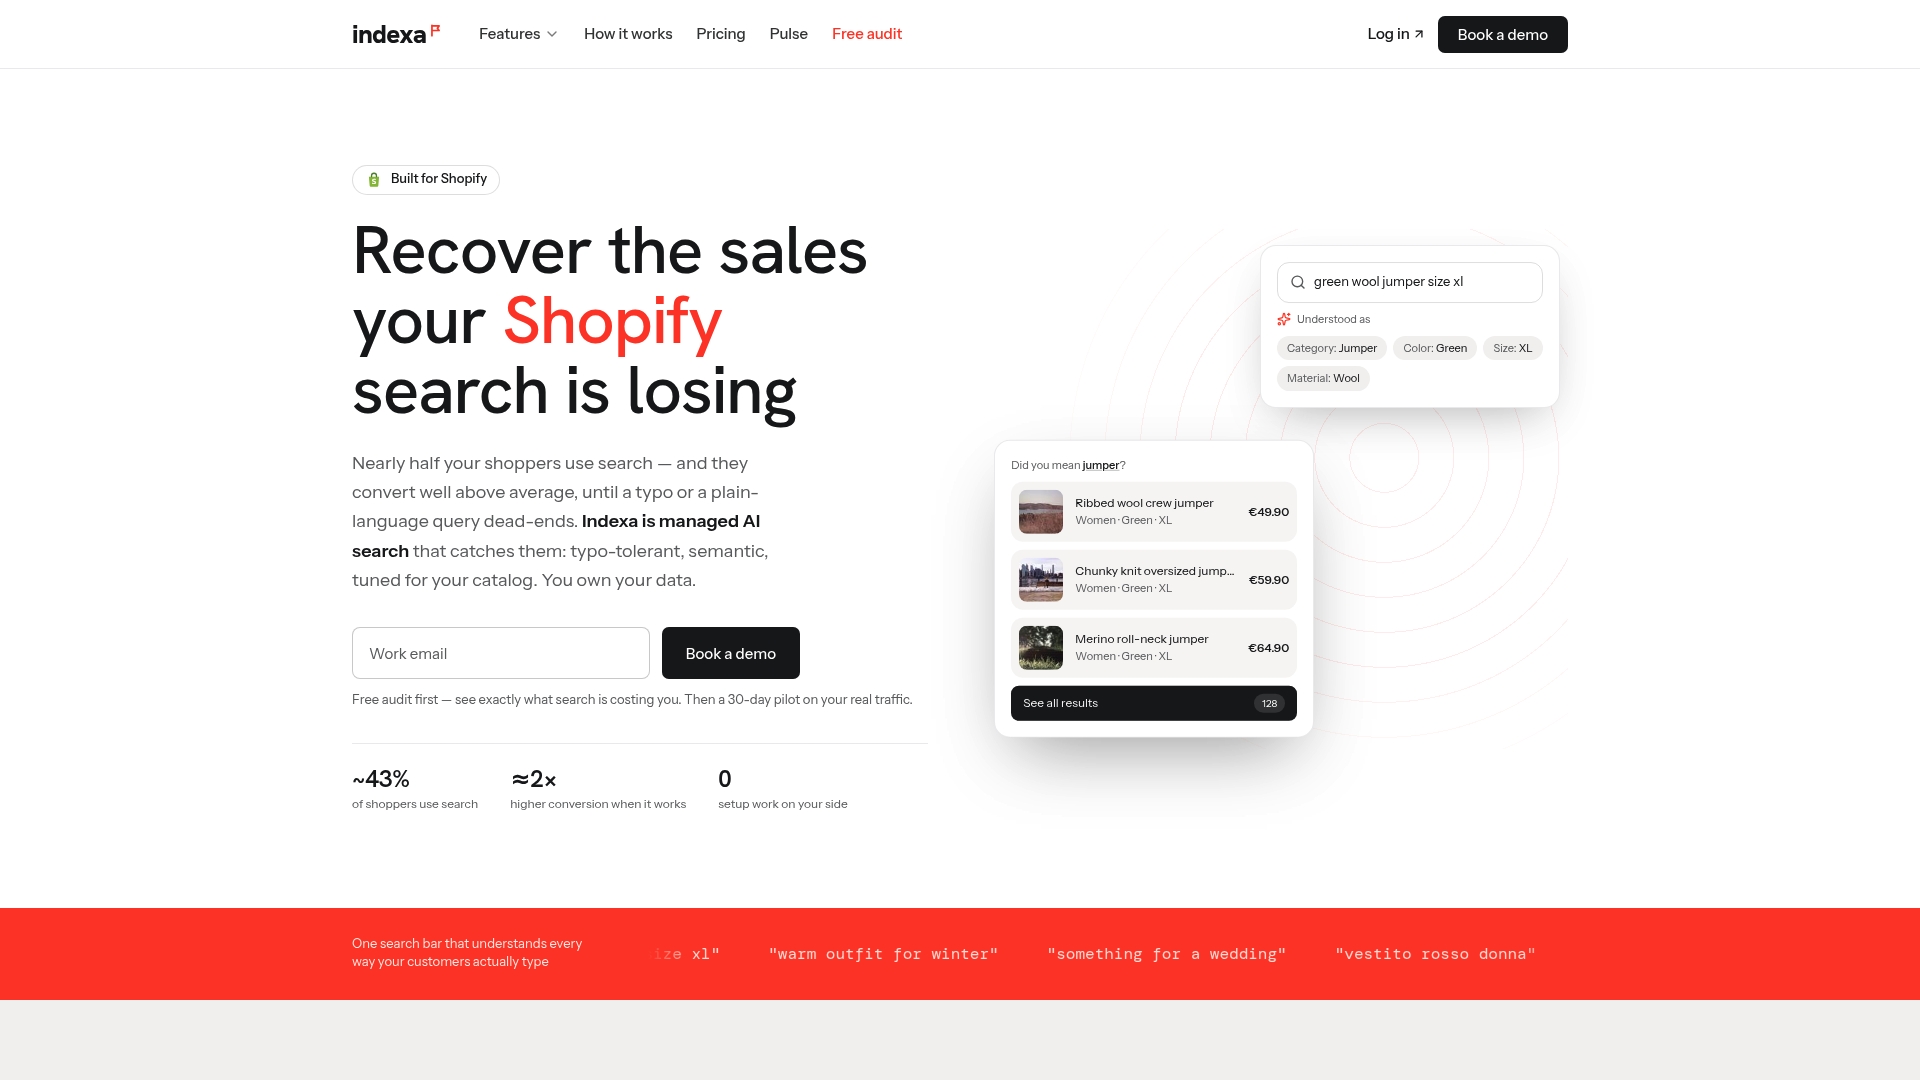
The free Shopify search audit reviews your actual search logs and hands back a ranked list of the queries losing you the most revenue, whether that’s zero-result terms, low-CTR results pages, or products buried under bad ranking rules. If you’d rather run the first pass yourself before bringing in help, the free search audit checklist walks through the same triage steps manually. For stores ready to hand the ongoing tuning to someone else entirely, the managed AI search upgrade covers typo tolerance, synonym mapping, and merchandising in one activation with no setup work on your end. Request the audit and you’ll need nothing more than store access to get your prioritized list back.
Documentation Worth Bookmarking
For the exact formulas behind every metric in this article, Google Analytics’ Site Search help page is the canonical source. Shopify’s own search_queries schema documentation covers query-level reporting syntax. Salesforce’s site search research summary backs the conversion-lift figure cited above, and Sitecore’s search dashboard guide explains advanced pruning metrics like low-value exposure rate. For broader analytics measurement thinking beyond search specifically, BabyLoveGrowth’s guide to measuring performance is a useful companion read.
Sources
- Ecommerce site search best practices — Salesforce
- How Site Search metrics are calculated — Analytics Help
- search_queries schema — Shopify developer docs
FAQ
What are some ecommerce metrics beyond search?
Core ecommerce metrics include conversion rate, average order value, cart abandonment rate, customer lifetime value, and traffic source performance. Search-specific metrics like zero-result rate and search conversion rate sit alongside these as a specialized subset focused on internal site search.
What is the 80/20 rule in ecommerce?
Applied to search, it means a small set of high-volume queries usually drives most of your search-related revenue, which is exactly why prioritizing by query volume matters more than fixing every rare search term.
What are the 5 C’s of e-commerce?
Definitions vary across sources, and there’s no single standardized framework confirmed by the sources referenced in this article. Common versions reference customer, content, convenience, coordination, and consistency, but treat any specific list as a general business framework rather than a fixed industry standard.
How do I know if my zero-result rate is too high?
Cross-check the specific failing terms against your catalog before assuming products are simply missing.
Does mobile search behave differently from desktop search?
Mobile shoppers tend to type shorter, more error-prone queries due to smaller keyboards, which raises the importance of typo tolerance and autocomplete accuracy. A search layer like Indexa’s semantic and typo-tolerant matching is built to handle exactly this kind of mismatch without requiring the shopper to retype a cleaner query.
Recommended
Make discovery work harder.
See what your Shopify search could do better with a free, hands-on audit.
Get your free search audit